
The main component of the water hammer seismometer is an 18 foot pipe filled with water. If that pipe moves back and forth along its length (say, due to an earthquake) the pressure on the ends will shoot up and down. If you haven't encountered the water hammer effect before fill a good length of pipe with water and seal it with your thumb at one end. Now suddenly move the pipe along its length away from you. The water will squirt out around your thumb. Your thumb has to accelerate that entire length of water to "keep up" with the pipe and water is heavy stuff so the pressure is quite high. The 18 foot pipe of water used in this seismometer would produce 8 psi if turned to the vertical and your thumb would be holding back about 6 pounds (assuming a 1/2" inner diameter).
Distant earthquakes don't cause much movement but a very sensitive pressure sensor can pick up the resulting pressure changes in a sufficiently long pipe. Without resorting to an expensive pressure sensor or extremely long pipe a simple seismometer may be constructed with respectable sensitivity. The simplicity of the mechanism is the main feature but the relatively high frequency response is also interesting for geophone experiments. The MPX10DP is inexpensive enough to contemplate an array of 10 of these feeding a summing amplifier. That just might start looking like a serious instrument. This is an acceleration sensor and one could add an integrator to get velocity but the low frequency noise looks like it might overwhelm an integrator - plenty of room for experimentation.
The diagram above illustrates the simple apparatus. Lay the water pipe on a flat and very level surface away from wind and weather, perhaps a basement floor or crawl space. It needs to be in intimate contact with the earth or structure movements will overwhelm the system. It should be reasonably level, too. The far end of the pipe has an elbow and a foot of vertical pipe. I leaned mine against the concrete wall to keep it vertical but a couple of cinder blocks would also work. The working end of the pipe is sealed except for a short length of flexible tubing that fits snugly over the nipple of the MPX10DP pressure sensor. I simply drilled an appropriate hole in a PVC end cap and glued the tubing in place with "Plumber's Goop." It's important to get all the air out of the pipe so pinch the tubing closed with a spring clip, lift the far end of the pipe a foot or two off the ground, and fill the pipe with water (including the vertical section). After a while all the air will work its way out of the tube. Shaking it and tapping on it can't hurt. The flexible tube will attach to the MPX10DP port near pin 4 (pin 1 has a notch) but it's important to get the air out of that port and the flexible tubing, too.
To get the air out of the transducer's pressure side I made a special tool from a glass pipette and a length of insulation from phone (or network) cable:
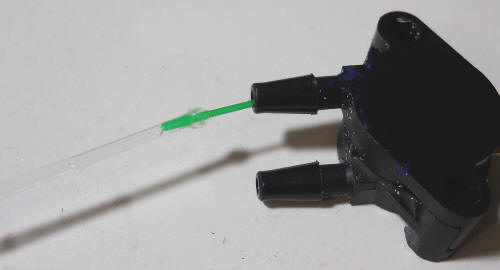
I stripped the green insulation off the solid copper wire but this time I was after the insulation. I glued the resulting tiny green tubing into the end of a chemistry pipette. There's any number of ways to do it; you just need a thin tube to get the water deep into the sensor's chamber. Holding the sensor vertical (not horizontal as in the photo) flood the chamber with water making sure the insulation tubing is near the bottom of the chamber. Keep squirting in water as you remove the tubing. There should be no air inside when you're done. Do this as a last step, right before you connect the flexible tubing. Remove the clip from the end of the flexible tubing and let a little water squirt out to remove any air. Now, the tricky part: Holding the transducer vertical bring the tubing down from above and let water squirt out as you mate the two. You should be able to feel confident that there's no air trapped inside. It's not really all that hard but I had to start from scratch a couple of times. Plus, you're probably doing this in a dark crawlspace. And another thing, once you get the tubing on the sensor in a satisfactory way glue it in position with Goop or a similar fast-setting glue our use thin cable ties behind the taper. I can't tell you how frustrating it is to get it just right only to accidentally pull it off with your foot when you try to leave. I mounted my sensor in a thick plastic case with only the two nipples sticking out and that prevented me from using thin cable ties to secure the tubes because I couldn't get to the back side of the taper. Cable ties just squeeze the tubing off the nipples in my arrangement. So you might cut a bigger hole such that more of the sensor sticks out. You can see that water will be splashing around so it's a good idea to mount the sensor in a plastic box and seal it with Plumbers Goop to keep the electronics dry. The other nipple connects to tubing that interfaces to an air-filled pipe of some sort; I used an old garden hose. This hose goes back to the far end and nearly closes the system. Next remove the excess water from the vertical section of the pipe. I held a length of clear tubing up next to the vertical section measuring how far to insert it to be just a little above the elbow, stuck it into the tube, and sucked out the excess water. The clearness of the tube allows me to stop sucking before I get a mouthful. : ) Add a splash of bleach and stick several inches of the garden hose into the vertical section. Don't make it an airtight seal so that the air pressure equalizes slowly, bleeding around the garden hose. My second garden hose didn't fit easily into the pipe so I literally sanded it thin with coarse sandpaper; those white with blue stripe hoses for RVs fit nicely.
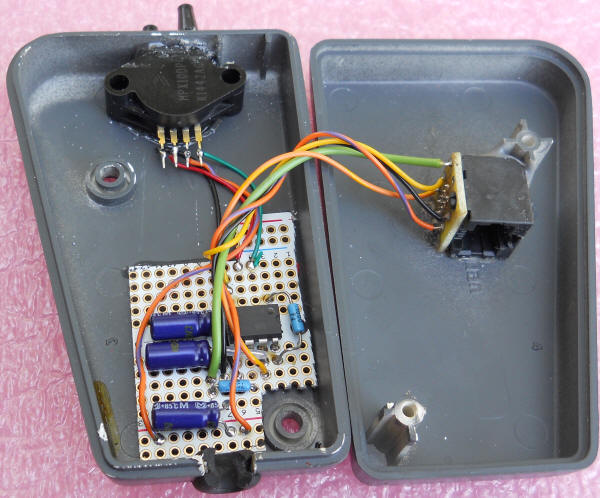
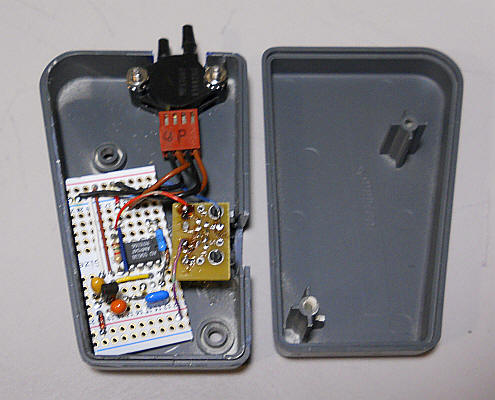
The version above uses the INA217 amplifier from Texas Instruments. There's a 100 ohm gain resistor and a 75 ohm resistor in series with the output - that's about it. I put 100 uF capacitors across +-15 VDC and +5 VDC. The amplifier is powered by the +- 15 volts and the transducer by the +5 volts. I use network connectors and cables to distribute power and signals, hence the black RJ45 jack. I put it inside with a grommet to seal the cable since I had a corrosion issue with the previous design. In retrospect it would have been better to solder in a cable and put the connector at the far end of the cable near the second amplifier (away from all the water). Note that I didn't put any inductor or resistor in series with the 5 volt supply to clean it up; the V/F is ratiometric and it's desirable that it "see" the same noise as the transducer. The ratiometric cancellation is in excess of 40 dB but only if both the V/F and pressure sensor are running off the same voltage. My first version used the AMP04 which is also an excellent choice. It runs on a single 5 volt supply and has provisions for adding a filter capacitor:
The schematic for the INA217 is similar but leave out the 0.47 uF capacitor, change the gain resistor to 100 ohms, connect pin 4 to -15 volts, and pin 7 to +15 volts (with caps to ground). Pin 5 and the transducer's Pin 1 go to ground and the transducer's Pin 3 goes to + 5 volts with a bypass cap. It's preferable that the transducer runs on the same 5 volts as the V/F to take advantage of the ratiometric rejection of supply noise. I added a 75 ohm resistor in series with the INA217's output just for stability.
With the AMP04 version change the 2k to 1k to achieve a gain of 100, if desired. More gain will be needed back in the lab anyway.
Please note: giving the first amplifier a gain of 100 runs the risk of amplifier overload so make sure that the DC output voltage is around 2 or 3 volts or at least well within the swing range of the amplifier. If your transducer has excessive offset or your water pipe is on a bit of a hill you might have too much DC offset for the amplifier. Simply lower the gain by increasing the gain resistor. The actual gain isn't particularly important. Or simply raise or lower the little box with the transducer in it with shims of some sort. The height of the box relative to the water pipe makes a difference. It might be nice to add test points for ground and output right at the first amplifier so you can see how it's doing when you are in the crawl space.
There are any number of amplifiers you may use including a homemade differential amplifier using ordinary op-amps. I've found the noise from the transducer is far higher than circuitry noise and precision isn't necessary either. So expensive amps are probably overkill and a simple 4-resistor op-amp differential amplifier is probably fine. You might wish to leave out the 0.47 uF when using the AMP04 as the bandwidth of the sensor seems surprisingly high. It makes a pretty good geophone using Spectrum Lab:
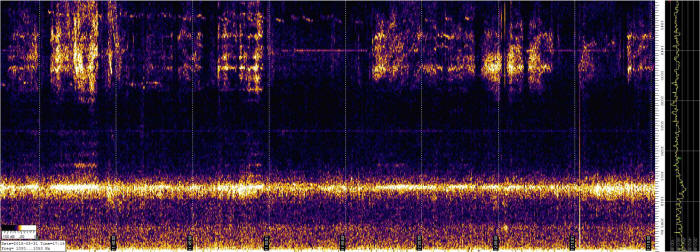
(Shows 0 to 50 Hz.) I can see all sorts of low-frequency signals from highway construction nearby (or so I assume) using Spectrum Lab from a couple of Hz to 10 Hz. There's also a resonance band at about 13 Hz that just might be the nearby highway bridge. It shows all sorts of "fine structure" perhaps as cars and trucks cross.
Here's another close-up image of the 13 Hz "resonance" captured late at night showing interesting structure that I bet is traffic crossing the long bridge:
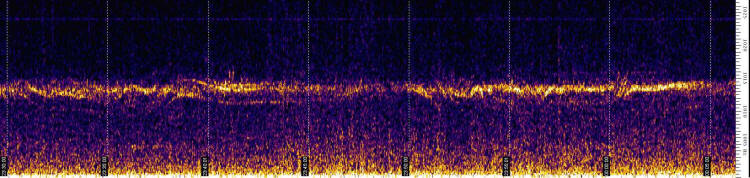
The vertical dotted lines are 5 minutes apart. If you are interested in geophone experiments just connect the sound card to the output of the first amplifier. The sound card should have plenty of sensitivity without additional gain; newer cards have all sorts of controls for the microphone gain. I used the "Infrasonic Converter" so I could see the very low frequency activity and it has a gain stage, too.
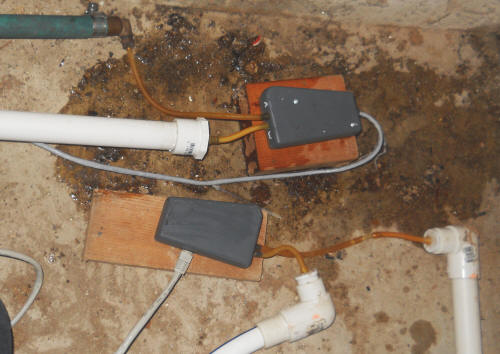
I've made two of these and here they are laying at right angles in a crawl space. You see the "working end" of the two 3/4" PVC pipes and two garden hoses for the air return. One garden hose is green and the other is white with a blue stripe. The unit at the top of the photo is the one in service now.
Now that you're back in the comfort of the lab, it's time to add another stage of gain for the seismic work. Make this stage AC-coupled but with a very low frequency limit. I use a 4 uF film capacitor in series with the input with a 10 megohm to a virtual ground for bias, giving a low frequency 3dB corner of only 4 millihertz or a time-constant of 40 seconds. The values aren't critical and you can use two 10 uF electrolytics back-to-back to avoid polarity issues. I perfer a film cap for this spot. 40 seconds is slow enough to see all the earthquake activity. It's also slow enough to make it annoyingly slow to come on when power is first applied so be patient; you might add a pushbutton switch across the 10 megohm to jump start the thing. The gain should be around 100 and may be varied by changing the 10k between pins 1 and 6. I've built this AC amplifier to have a zero point at 0.5 volts out which is 1/2 scale for the 0-1 volt input, 0-30 kHz V/F that it will drive. This gives 15 kHz for the zero value. I'll count that for about 133 mS with a PicAXE giving a center value of around 2,000. Call it 2048 and it can be considered 1/2 of 4096 which is 12 bits of resolution. I've built in a low-frequency roll-off of around 3 Hz.
Here's my AC amplifier stage:
Note: On mine I've lowered the 1 megohm from pin 6 to pin 7 to 470k for a gain near 48.
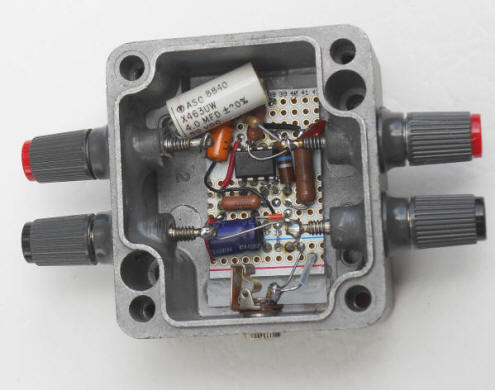
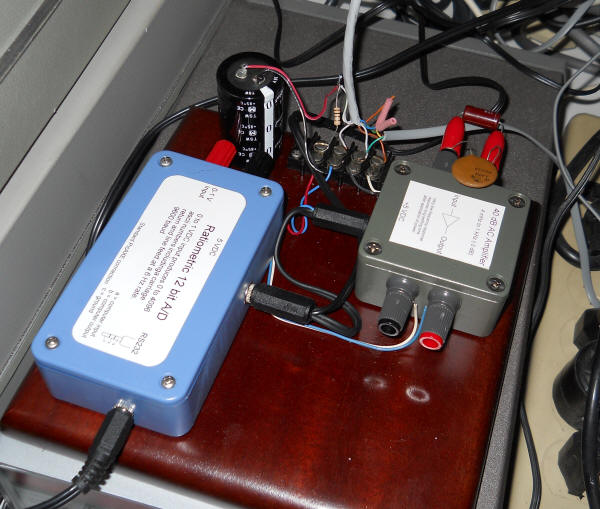
For collecting data feel free to use any convenient technique including the inexpensive Dataq DI-145 (Note: Select "DATQ155" in the device list to get the DI-145 to work properly.) or even the very simple "Inexpensive Data Logger for Amaseis ." But the converter below is fantastic and most avid experimenters have the parts on hand. Three modules inside include a PicAXE, a clock generator and a ratiometric voltage to frequency converter. Each module is described below.
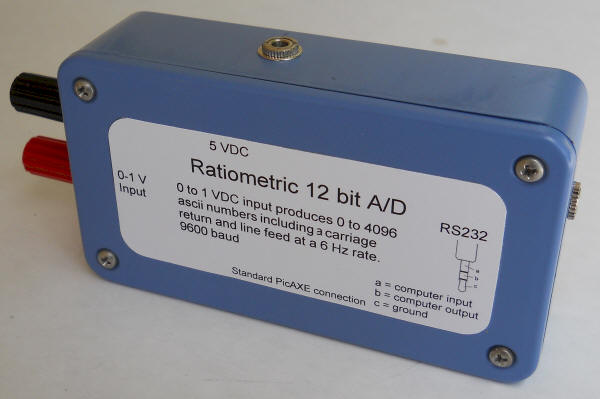
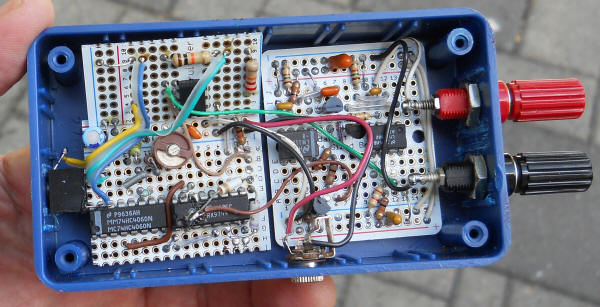
The black connector to the left is the stereo plug for the PicAXE serial connection, the silver mono plug at the bottom is for +5 VDC from a power adapter, and the banana jacks are the analog input. The PicAXE board is to the top left and has only three parts on it (the power supply bypass is actually on the clock board below). The V/F is off to the right.
I'm using a freeware program called Amaseis and a related newer program called jAmaseis that are intended for plotting earthquake data much like the mechanical "helicorders" that use large drums wrapped with graph paper. The plots are stacked close together since most days show no activity but an earthquake is allowed to write over the space occupied by the other traces. It's an efficient way to display relatively rare events and the hour lines with virtually straight lines become horizontal grid lines. I recommend Amaseis if you can get it to run on Windows 7 or 10 (haven't tried) but the Java-based jAmaseis will most certainly run and it's currently supported. I just like the original's interface and display and I'm using it on XP.
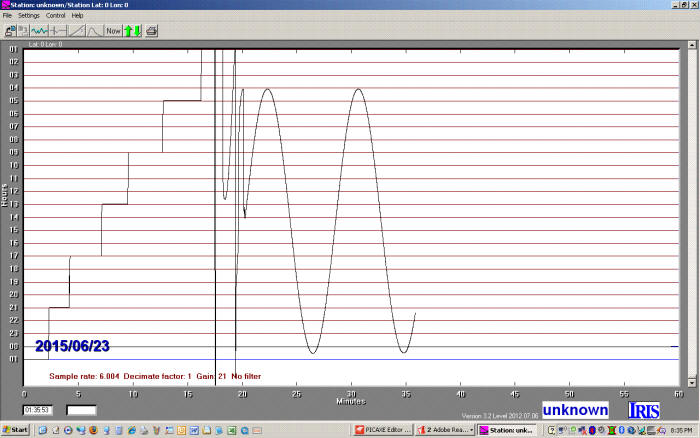
The PicAXE-enabled V/F above sends serial data to the computer at a rate of six data points per second. All Amaseis needs is the COM port number and it will plot those data points. I discovered the COM port with the PicAXE editor and used that value for Amaseis. That's really all it took. Here's an Amaseis plot first showing voltage steps from 0.5 volts to 1 volt (stair steps) and then some fiddling around followed by a .002 Hz sine wave from a DDS synthesizer. This is using the 30 kHz V/F and the 6 Hz crystal clock driving a faster (newer) PicAXE 08M2. Data is sent to the Amaseis program at a 6 Hz rate with 12 bits of resolution. The V/F input can be reduced to 0 volts and the trace goes off the bottom of the plot. That part of the plot would slowly appear as the hours go by. This is really good resolution for such a plot.
When using Amaseis set its gain to at least 20 (I'm now using 35). This will ensure that the quakes can fill the entire screen. Too low of a gain and the traces with be clipped when the "big one" hits. If the trace is too noisy or sensitive lower the gain of the AC amplifier. Also, try activating the filters within Amaseis with the high frequency limit set to 10 Hz and the low frequency limit set to 0.05 Hz. Remember to click the radio buttons to activate the filters in the filter menus and also in the higher level Helicorder menu.
A PicAXE 08M2 (8 pin) microprocessor is used to count 30 kHz V/F pulses and send the result to the Amaseis program at a rate of 6 per second. The PicAXE schematic is quite simple as it uses the same serial connection to send data as it uses for programming. (New computers don't have a serial port so a serial to USB adapter is required.) I change the PicAXE clock speed to set the baud rate to 9600 (when using the sertxd command) and I tell Amaseis that the data taker is something called "SEPUK1."
It's not a very complex circuit! Don't shy away from this because a "microprocessor" is involved. These things a trivially easy to use. Think of them as custom ICs that you "create" by pasting the program into the editor and clicking on "program." You could tape some paper over the program area and never see the code at all. : ) It's really much easier than you might think. Serial in, serial out and ground go to a USB/serial dongle for both programming and data-taking.
Many commands assume the clock speed is 4 MHz but I switch the clock between 32 MHz and 8 MHz so some of the functions are sped up (like "pause" and "count"). Simply copy the program below and paste it into the PicAXE editor, comments and all:
| Main: | ;this is the "main" program. Names followed by colons are like line numbers in the old Qbasic days - places to "go." |
| setfreq m32 | ;this sets the microprocessor internal clock speed to 32 MHz - that's all the "main" program does |
| counter: | ;I call this section "counter" for obvious reasons |
| count 2, 1200, w0 | ;counts pulses on input 2 (pin 5 - go figure) for 150 mS which needs to be a bit longer than the 133 mS clock pulse width |
| setint %00000010,%00000010 | ;this sets the interrupt to input 1 (pin 6) with a positive polarity - this command isn't obvious but clearly documented |
| pause 1000 | ;this waits 125 mS but the interrupt terminates this pause, setting the value to the end (completed) |
| goto counter | ;go back to "counter:" happens immediately after the interrupt since the interrupt sets the pause value to the end |
| interrupt: | ;this is the subroutine that is run when an interrupt is detected. This name isn't arbitrary. |
| setint off | ;turns off interrupts - we've already been interrupted so give me a moment - arguably not "necessary" to do. |
| setfreq m8 | ;turn the clock speed down to 8 MHz so that Amaseis is happy with the baud rate. Tell Amaseis you're using "SEPUK1." |
| sertxd (#w0,13,10) | ;Use sertxd command to send count, carriage return and line feed; you're using the same serial port for programming. |
| w0=0 | ;reset the count variable w0 to zero. |
| setfreq m32 | ;speed the clock back up to 32 MHz |
| return | ;return from the interrupt |
The PicAXE attempts to count pulses for 150 mS (1200 mS * 4 MHz/32 MHz) but while it's counting the V/F is stopped by the clock circuit at 133 mS. This gives the crystal-controlled clock circuit control over how long the PicAXE counts. (Setting the PicAXE count window to 150 milliseconds insures that the counting continues past the point where the V/F is stopped so as to not miss any pulses.) About 17 mS after the V/F is stopped an interrupt pulse is generated. When the interrupt occurs the count value is sent to the computer and the count is reset. This happens quickly, before the next clock cycle begins. The "pause" in the program is a "waiting place" where action stops until an interrupt happens. I'm taking advantage of the fact that an interrupt sets such pauses to their end after the interrupt; the pause is forced to be done and the program immediately starts a new count.
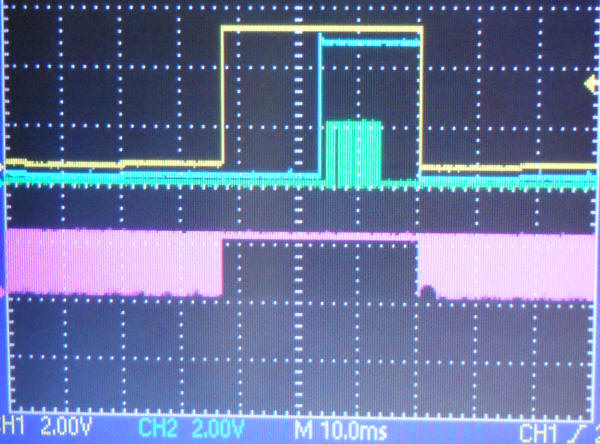
You can see the action in the image below. The yellow trace is the 6 Hz clock and you can see how it turns the V/F on and off via that NPN transistor (red trace at the bottom). The diode AND circuit produces the large blue pulse that interrupts the PicAXE well after the V/F has been stopped, halfway through the clock pulse because that was easy to generate with the AND diodes. The interrupt routine reads the count and sends the data to the computer shortly after the interrupt (green smudge of short pulses are the serial data). You can see the serial communication is finished well before the next counting window. That 6 milliseconds is plenty of time to set the count back to zero and to reactivate the count function. The V/F is still gated off so no counts occur until the yellow pulse drops again. The crystal-controlled yellow pulse is therefore in complete control of the count window instead of the less stable PicAXE internal oscillator.
Here's the simple 6 Hz clock that will turn the V/F on for 80% of the cycle, about 133 mS (active low - yellow trace above). This 6 Hz signal is tied to the "stop" input of the V/F halting the converter when that line goes high. About 17 mS later, the interrupt line goes high, causing the PicAXE to send the pulse count out the serial port and then to reset the count. That all happens before the next counting cycle when the 6 Hz line drops low again. I avoided using another IC by using two diodes to perform an AND function. You will note that I actually used germanium diodes. : ) Ordinary silicon diodes should work fine but schottky diodes will give a lower voltage low logic level, not that it's needed.
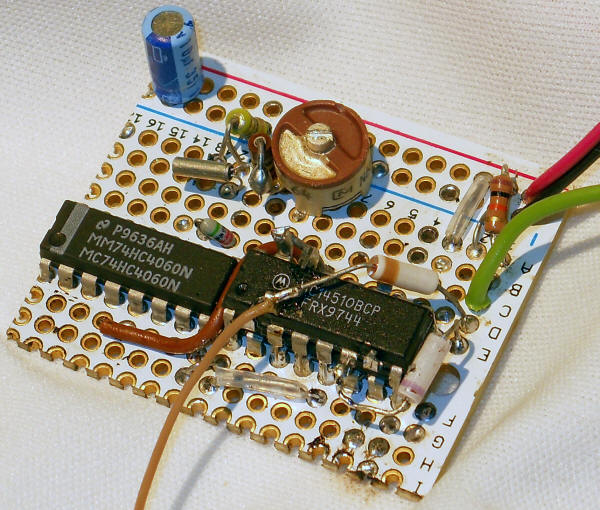
Note that I stacked the '4510s since they share so many common pin connections. I also connected the unused programming pins but those could just as well be cut short. The "6 Hz" output above connects to the "Stop" input below.
Ratiometric V/F Converter
See the somewhat slower Peculiar Data Logger for more information about this type of V/F.
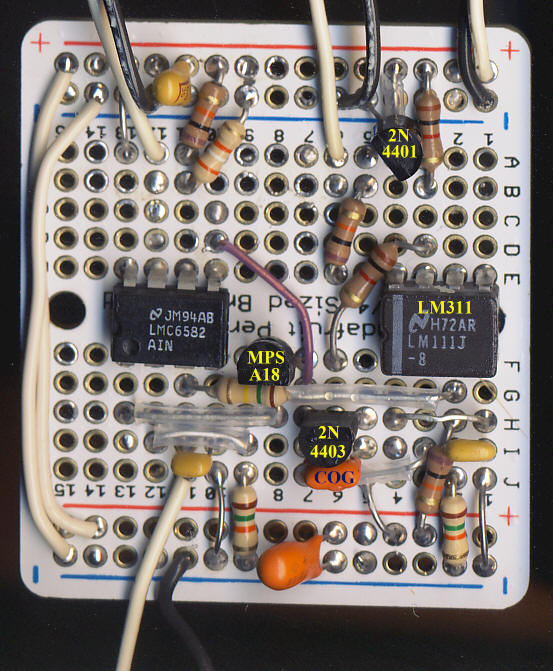
This new circuit outputs 0 to 30 kHz for 0 to 1 volt input with a non-linearity of about 0.02% without tweaking the 150k linearity resistor (30 kHz x .02% = 6 Hz, the deviation from the expected value). It behaves nicely for "over-voltage" input, outputting 60 kHz with 2 volts input while exhibiting only 0.07% non-linearity (still as good as a typical 3 digit meter). Adjusting the 150k would improve that. (I tweaked the 150k on the prototype by adding another 4.7k and got under 0.01% non-linearity for the 30 kHz span.) Keep in mind that 0.02% is less than one bit at 12 bits resolution.
It's unique in that it runs on a single 5 volt supply and uses ordinary parts. The op-amps should be "rail-to-rail" on input and output and be designed to work on 5 volts. The MPSA18 is important so avoid substitutions; I've never encountered a suitable substitute that gives this performance. But, frankly, do you need to know the peaks of an earthquake to 0.02%? : ) It's just fun to get the performance. For the PNP choose a transistor with the same die as the 2N4403 as this die has a nearly zero saturation voltage temperature coefficient. The 2N4401 is not critical at all. The capacitor needs to be a 1000 pF COG (NPO) type or other very stable type like mica; don't use an ordinary ceramic type. A polyester (Mylar) type will work if the ambient temperature doesn't change very much. The 15k from the emitter of the MPSA18 to ground sets the gain of the converter.
Eventually this circuit will be driven by an amplifier biased to 0.5 volts for a mean output frequency near 15 kHz. It will be a "super-slow" AC amplifier that responds to slow earthquakes but averages 0.5 volts output over several minute periods. A PicAXE will count the pulses and send the data to the Amaseis program at a rate of 6 per second with a 12 bit resolution. The 6 Hz clock will enable the V/F via the "stop" input for 80% of the 6 Hz period, about 133 mS. So if the full-scale frequency is 30.72 kHz, the maximum count will be 30,720 x 0.1333 = 4096 (12 bits). Simply instruct Amaseis that the "offset" is around 2048.
I prefer the V/F for slower applications because it averages the input over the entire measurement interval; there's no need to average hundreds of measurements to reduce noise. It has a ratiometric response that is perfect for pressure sensors and other devices with outputs proportional to the excitation voltage. The slight non-linearity is "smooth" and spread gently over the full range with no sudden discontinuities; a V/F is naturally monotonic. This particular circuit is "open loop" so there's no jitter caused by feedback; the low-frequency stability is surprising considering the top speed.
Confession time: I had interference on the power supply lines getting into the first amplifier so I added a 100 ohm resistor in series with the +5 and a 15,000 uF to ground (the black capacitor). That did the trick but it does eliminate that "ratiometric" cancellation I was bragging about for audio frequency. But the ratiometric cancellation is still effective for the frequencies produced by earthquakes. Higher frequencies are rolled-off anyway.
Here's one of my first "catches."
One can highlight an interesting trace on the Amaseis plot and click on "extract earthquake" to get just that one plot as above. The cursor may be moved around to read precise values and the plot may be stretched out in time. I'm really liking this program for very long term chart recording where fairly fast data rates are needed when something happens.
Here's a typical Amaseis plot showing a small earthquake. Notice the "glitches" all over the plot. Those are caused by the water pipe shifting due to temperature changes in the crawl space. In this particular orientation I had to raise the pipe to clear some boards and I just used a few bricks. Clearly I need a better support technique. Try to lay your pipe directly on the ground.
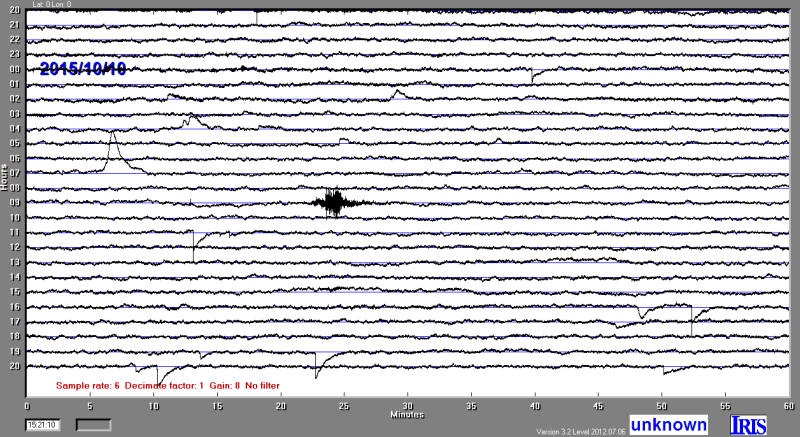
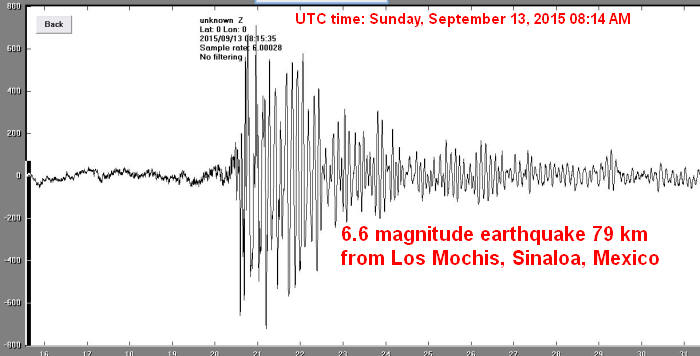
Today I caught an earthquake in Mexico at a right-angle to the expected direction of maximum sensitivity. This sensor is "pointed at" California but it had no trouble picking up this quake.
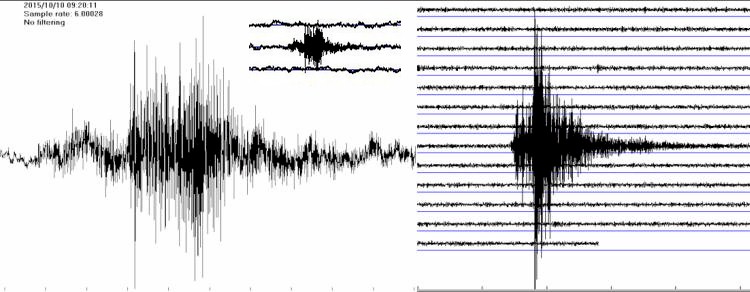
Here's another recorded 10/10/2015 from a small 4.4 magnitide quake in Oklahoma (same one as on the multi-trace image above). The inset shows how it looked relative to the other traces. The plot to the right is from a "real" seismometer located at the University of Texas. The water hammer seismometer isn't nearly as sensitive but it can see pretty small quakes. I think the U.T. seismometer is a vertical sensor and mine is horizontal and "pointing" east and west, not that it seems to matter much. It's pretty exciting to see a distant weak earthquake with a tube of water. : )
The following images surprise me. The top image is the water-hammer seismometer and the one below is a "real" seismometer at the University of Texas. Mine is obviously horizontal sensing and theirs is vertical so they're not expected to perform the same but I never expected to be able to see tiny quakes better with mine! The difference is even more pronounced if I turn up the gain on mine to equal their background noise.
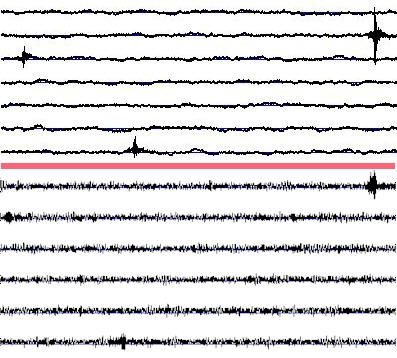
The first quake above occurred about 1:57 UTC on 12/13/2015.
Just for historical purposes:
I used LTSpice to calculate the expected sensitivity (see the file). It seems like I might be able to readily see changes on the order of .33 um/sec if they're fast enough, around 0.5 Hz or above. That's a full minor division on some seismometers. (The transducer seems to wander about 250 nV p-p.) Below that frequency the noise from the transducer is higher. At 0.1 Hz, I'd struggle to see 1 uM/sec. at best.
Here's the first version using the AMP04:
The V/F and PicAXE combined with Amaseis make for a nice long-term data collection system with a fairly quick 6 sample per second measurement rate. The PicAXE program could be modified to send data to a spreadsheet at a slower pace for other experiments such as SIDs monitoring. There are many inexpensive ways to measure a voltage to 12 bits but the V/F gives a perfect average over the measurement interval and the near-perfect monotonic response makes high resolution measurements possible. Connecting the V/F to a modern high-resolution counter gives surprisingly good results, especially when the V/F is operating at a fraction of full-scale. This 30 kHz version will give 16 bits of resolution simply by extending the count window to 2 seconds.