
I read an article that suggests that the rate that a radioactive isotope decays is somehow effected by solar activity. So, I decided to try to build a detector using smoke detector elements containing bits of americium. The idea is to monitor the ionization caused by the radiation to see if it drops by a few tenths of a percent right before a solar flare. A negative result is expected and not necessarily conclusive, since americium's alpha decay might be relatively immune to the phenomenon, whatever it might be. However, a positive result would be interesting! The challenge is to reduce ordinary influences like temperature and humidity to low enough values to see anything hiding underneath.
Update: I'm ending this experiment for now. I may start it up again with Carbon 14, but it's a big effort to change over, so it may not happen.
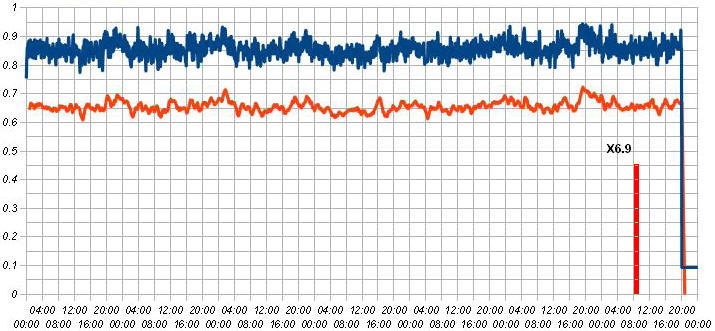
I don't see anything convincing on the chart. In fact, it's rather flat during the flare, and there are not significant dips for nearly a week prior to the flare. The scale is in percent of full scale, so the reported 0.3% variation that was attributed to similar flares would be six divisions on this chart, visible as a downward deflection. It's simply not happening. Negative results aren't as convincing as positive and there are reasons this experiment might be failing (using an alpha emitter, for example), but the simpler explanation is that the effect doesn't actually happen.
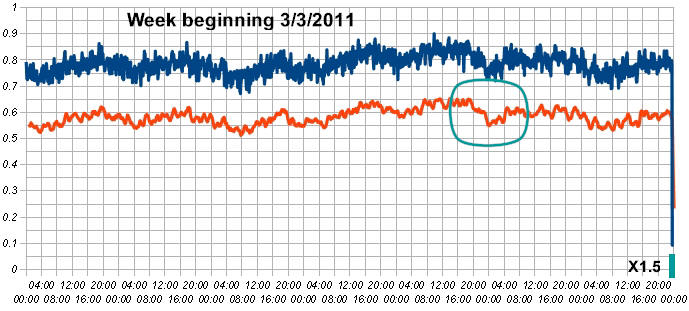
Another X class flare right at the end of the week. There's an interesting downward glitch about 24 hours earlier. Also see the plot below for a similar pair of events. The downward glitches will be steeper, since the chart now displays a full week of data.
What is causing this daily sine wave variation? It isn't temperature or pressure and the previous week that I lost had a nice "sine wave" all through the data, too. It's a mystery, unless the sun somehow does it. I also verified that it isn't simply increased background radiation. That's between one and two orders of magnitude too low.
Well, finally a good-sized flare (X 2.3). Here's the disturbing graph:
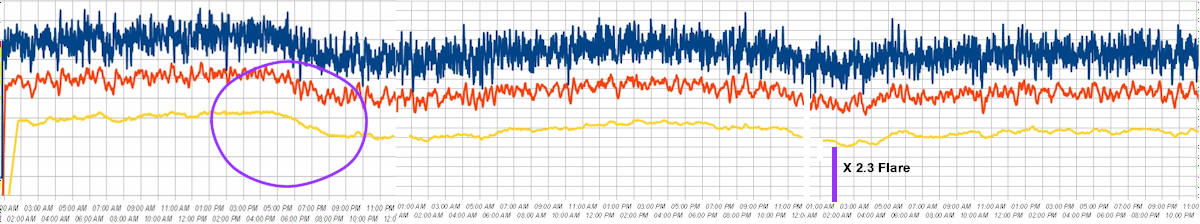
I can't explain that dip a little over a day earlier. I do get wandering nearly that big, but this just looks like a bona fide dip. There are three graphs combined, and the first has a different scale that I corrected by stretching the image. In the first image, one division represents 0.1% of span and, in the following graphs, one division is 0.05% of span. That dip is a solid 0.1% drop, if not a little more. The graphs haven't been wandering that much and steps are much smaller. It "kinda" looks like something is happening, after all. It would have been nicer if the dip were much larger, since this is still possibly random wander. Notice the second dip right at the flare. I wonder if there will be another big one tomorrow.
I've moved the older posts to https://www.techlib.com/solarflareold.htm .