
Also see new ideas at wenzeltech.com
(or other programs)
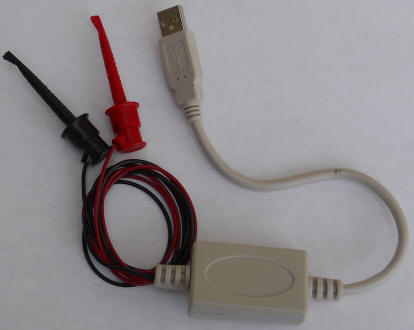
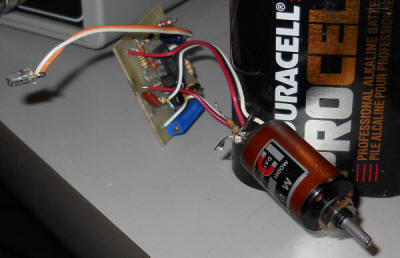
A PicAXE measures the voltage on an analog input pin and sends 10 bit data to Amaseis for plotting. I decided to dedicate a $6 USB to serial adapter to the job and when I opened the case I discovered enough room for the PicAXE and the few needed resistors. There's 5 volts in there, too. Originally I planned to take out the board and move it to my own larger case. The red and black test leads come out the hole previously used by the DB-9 serial connector.
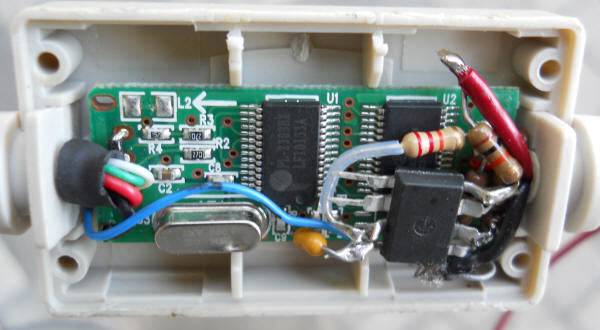
I used "dead bug" construction making sure to keep everything low so the case would snap back together. Before removing the 9-pin serial connector from the adapter I plugged in a PicAXE programming cable with the stereo phono plug on the end and used an ohmmeter to discover which two serial wires inside the adapter I needed, making a note of which color did what (serial in and out). I also found a place to connect a wire to the +5 VDC from the USB cable at the other end. There was a handy via in the board for that yellow 0.1 uF capacitor. The schematic is quite simple:
I used a voltage divider on the input giving the device about 10 volts full-scale range (mine tops out at about 9.5 volts). These resistors also protect the PicAXE from damage to some degree. Feel free to add an op-amp buffer here; I'm shooting for simplicity. Here's the simple program for the PicAXE:
main:
setfreq m8
senddata:
for b0 = 1 to 64 ; the sum of 64 10-bit readings fits into a 16 bit word
variable
readadc10 2,w1
w2=w2+w1
next b0
w2 = w2/64
sertxd(#w2,13,10)
w2 = 0
pause 200 ; this is actually a 100 mS pause due to the higher 8 MHz clock
setting
goto senddata
The "pause 200" could be increased greatly or even replaced with a little loop to slow down data taking for other applications. The 100 mS pause combined with the for loop gives about 6 readings per second, a fairly common rate for seismometers apparently. You may need to play with that pause value to get your desired rate especially if you switch PicAXE types. I'm using the older PicAXE08M. It works well; here's a plot of a 30 millihertz sinewave biased up to 5 VDC and swinging about 9 volts p-p:
Once the device is built, simply plug it in and start the PicAXE editor program. Find the right com port and select the right PicAXE and paste the program above into the editing space. Then simply click the program button. When it's done close the editor and wait a few seconds for the port to be released. Now start Amaseis and select the right com port. Also set the "device" to "SEPUK1." Set the offset to zero and the gain to 20. You should be able to apply a DC voltage to the input and see the result on the plot with a sensitivity of about 1 volt per "division" where a division is one of the hour lines. Adjust the gain and offset to suit your purpose. Amaseis plots will overlap if the data moves around a lot but simply drag the cursor across the time of interest and click on "extract earthquake." Remember to highlight the desired time on the appropriate line and not the data itself which might be moving all over the screen. Once you play with Amaseis a bit you will discover it's a quite versatile data logger.
This little thing could be used for other programs that accept serial data. The program is easily changed since it has a built-in USB interface - just remember to close any other program using the serial port so that the editor can take over. You can also change the program to send data to a spreadsheet using the Autohotkey script described below. That script lets you send "navigation" commands to a spreadsheet.
Remember, you can stop Amaseis (or other application), start the PicAXE editor, make changes to the PicAXE program, close the editor and restart Amaseis - all without touching the hardware.
Note: Amaseis is great for AC-coupled data but not perfect for DC-coupled measurements. When you select a section of time to "extract" the zero point is the average of all the selected data. That's great for centering the waveform but it looses the DC information. I'm still looking for a free DC-coupled strip chart recorder. But this program is perfect for lots of data over long periods of time from seismometers, infrasound microphones, SID monitors or any quantity that deviates from a "normal" level. I haven't used JAmaseis yet but it seems to have an "offset" value so perhaps it preserves the DC value.
1) The Meter/Data Acquisition Amplifier works with inexpensive data acquisition devices that typically take +- 10 VDC measured to 12 bits of resolution. This amplifier amplifies and offsets much smaller voltages to give better resolution. It generates its own negative voltage to take full advantage of the DAC's input range.
2) Use a microprocessor to directly measure the desired voltage using an analog input pin. (I use various PicAXE processors). Have the micro send serial data to a computer, typically over the same connection used to program the micro. Use my AutoHotKey script below to receive the data and send it to a spreadsheet or other program.
5) Build a Keyboard Wedgie and let it type binary data directly into a spreadsheet.
6) Build a V/F converter, connect its output to the sound card and use Spectrum Lab, Argo, or another FFT program to plot the frequency. You can get pretty fantastic performance this way.
7) Another V/F with a PicAXE frequency counter. Great for sending data to a Helicorder program like Amaseis
AutoHotkey Scripts for Serial to PC data transfer (Make sure to visit the Sidseizer page in the near future: I'm adding a new data taker with an AutoHotKey script and LibreOffice spreadsheet - works nicely.
Here's a zipped folder with a couple AutoHotkey scripts. The .exe versions will run without any other software and the .ahk versions require AutoHotkey (but then they can be edited). These programs receive serial data, say from a PicAXE microprocessor, and send the data to any program, in the case of the "any" version or to an Openoffice.org spreadsheet in the case of the "calc" version. The "calc" version attempts to open an openoffice.org spreadsheet and then waits for you to "save as" to start. (Don't Forget to "Save As" or it will just sit there!) The "any" script prompts you with a pop-up window giving you a few seconds to click where you want data to go and will let the external device send data to any program - it just starts typing!
You will need to know what serial port your device is using. To start, hook your serial device to the computer, typically a USB device or USB adaptor, then go to "Devices" and see what COM port was assigned and remember that port. (If you are using a PicAXE you can also discover the COM port by running the PicAXE editor and selecting "options" then "serial.") Run the script and answer the questions. If you are using a PicAXE's programming serial port set the baud rate to 4800 and leave the other settings as-is.
PicAXE and other serial devices have a short list of "commands" available in the script for navigating the spreadsheet and these are easily modified or eliminated by opening the .ahk file using AutoHotkey:
My script "hijacks" three direction symbols, replacing them with the desired navigation commands for the spreadsheet. The "up" arrow is replaced with "ctrl-home" to go to the first cell, the left arrow with "home" to go to the first cell in a row, and the right arrow with "tab" to jump one cell to the right. I did that to make the PicAXE programming easier. Those 'if' statements could be easily stripped or commented out from the .ahk version of the script if the symbols are needed for some other application. The PicAXE editor recognizes "CR" and it is unmodified by the script. It is used to drop down to the next row in the spreadsheet. A description of the function of these altered characters in an openoffice.org spreadsheet appears when the script runs.
This can be a cheap setup! If you buy a simple PicAXE, make your own programmer (two resistors, basically) and buy a cheap serial to USB converter this just might be the cheapest way to get data from your experiment directly into a spreadsheet or other program. I think I could start from scratch and do the whole task for under $15.
Here's a little PicAXE program that sends 3 columns of numbers for 20 rows then starts over - just for testing out the system. In your project those variables would contain data instead of a sequence of numbers. There are comments in the listing that explain how it works. Here's how to use it:
Install Openoffice.org on your computer if you don't already have a spreadsheet program.
Plug the PicAXE serial cable into the computer and go to "Devices and Printers" to learn what COM port was assigned to the serial interface (or select "options" and "serial" in the PicAXE editor).
Load the PicAXE program into a suitable PicAXE chip.
Close the PicAXE editor program so that it releases the COM port.
Run the AutoHotkey .exe script on your computer using 4800 for the baud rate and using the COM port you discovered for the serial interface.
Select "save as" in the spreadsheet and the data should start to appear. You might have to say whether or not to write over an existing file if one already exists.
The "any" script is similar in function except that you click on "start" then quickly click where you want the data to go, perhaps in a cell in a spreadsheet or on a page in a text editor. (You don't have to be quick if the serial device isn't sending data yet.)
Notice that you program the PicAXE over the serial cable then it immediately starts sending data back over the same connection! It does mean that you have to close the editor or the spreadsheet so that they don't compete for the same port. Don't worry, the computer will remind you.
Keyboard Wedgie takes 10 bit measurements and types them directly into a spreadsheet. The "deluxe" version features some "fun" ideas.
This device simulates a keyboard and could be used with just about any operating system or computing device. A drawback is that the device requires the complete attention of the computer; it will start typing data into whatever application has the focus. It's great for dedicated setups where installing software is out of the question. I use mine all the time because I can simply plug it into any computer and off I go. You will need to "gut" a keyboard to get the PCB.
(Also see Water Hammer Seismometer for a 5 volt version that outputs 30 kHz.)
This is a pretty strange data logger but the performance is excellent. It uses my ratiometric voltage-to-frequency circuit to make a wireless data logger for a PC. The output of the V/F drives an infra-red LED and a photo-transistor at the computer receives the signal and analyzes it using an FFT spectrum analysis program like Spectrum Lab or Argo. Those programs have features for automatically saving plots and Spectrum Lab is a treasure-trove of other features making this data-taking scheme quite versatile. The FFT program can accommodate lots of signals so adding channels is as simple as building more converters and aiming the new IR LEDs towards the photo-transistor receiver. The circuit is quite inexpensive, employing a cheap quad comparator and a couple transistors:
(Don't choose subs for the MPSA18 and 2N4403, if possible. The 'A18 has very high gain, even at very low current and the '4403 has a zero temp-co saturation voltage when biased as shown.)
The front-end of the V/F accepts 0 to1 VDC and convert it to 1 to 2 kHz. The output of the converter drives an IR LED to transmit the signal across the room. An optocoupler or audio transformer could also be used. A direct connection will work but computers tend to have electrically noisy grounds. The accuracy and linearity of this circuit are surprising. With the 560k linearity resistor the overall accuracy is probably about 0.2% of full scale (assuming it's calibrated well). Selecting the linearity resistor for best performance can yield 0.05% linearity or better depending on one's patience and equipment. All the resistors are 5% types in the prototype and the accuracy is achieved by tweaking the emitter resistor for the proper gain and adjusting the "position" control to place the trace at the desired spot on the display, typically the screen of a program like Spectrum Lab. Here's a small screen from Spectrum Lab:
I made those steps by hand with a 10-turn pot hence the squiggles at the edges. By instructing Spectrum Lab to subtract 1 kHz from the spectrum display the frequency in Hz corresponds to millivolts. The converter is accurate beyond the ability to resolve on the screen even when it's full-size. The V/F was on a bench across the room and held down by a heavy battery (just for the mass):
The V/F is the little board with the blue gain pot. The big pot is the "position" or zero offset control. I don't have the resistors in each end of the position pot so it's a bit sensitive. The IR LED is pointing at my desk where the photo transistor resides.
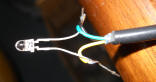
At this point the receiver is nothing more than an infra-red photo-transistor with the collector tied to the tip and ring and the emitter tied to the ground of the microphone input. The microphone input supplies the power for the transistor. The signal is huge even without any IR filter material over the photo transistor. I'd recommend using a black plastic IR photo-transistor since they have built-in visible light filtering. Just for kicks I tried a program called Argo using a mode called QRSS 20 with and offset of -1 kHz:
 |
 |
Receiver phototransistor and a close-up from Argo
The little plot on the right shows the results of a 1 mV step on the input. It jumps around at the transition because I'm trying to set it by hand with a ten-turn pot. I think you can see the wires in the pot on the plot! My voltmeter was reading 610 mV before I adjusted it down to 609 mV. That's some nice resolution! The plot is quite impressive when it fills the screen and the accuracy and stability of the V/F shines.
It's a slower data taker that would lend itself to weather instruments, radiation measurements, propagation plots, and other slow-moving data. The audio format makes data logging as simple as grabbing a voice recorder or a smart phone with an app. The signals from several V/Fs could be transmitted along a common wire if the IR link isn't practical. Single channel links could use a tiny AM or FM transmitter to a suitable receiver; it's just audiio.
Here's my original circuit that shows a few optional front-ends. This version produces 0 to 10 kHz with surprisingly good performance at very low frequency. When using an FFT program it's best to restrict the frequency range to a single octave to avoid harmonics appearing on the plot. So I'd offset the input to have a minimum frequency that is 1/2 full-scale, as is done with the open switch in the optional input circuit schematic to the left.
Use rail-to-rail op amps for the level shifters above.
Here's a list of advantages to this ratiometric V/F:
More measurement resolution is easily had by simply counting longer (4.5 digits in 1 second and 5.5 digits in 10 seconds for a 10 kHz V/F) or by using a high resolution period measurement or fractional cycle measurement.
Ratiometric response rejects excitation voltage variations when using bridges or voltage dividers. Simply run the V/F and sensor on the same voltage.
The signal is inherently averaged over the full measurement interval.
Open-loop design gives very low jitter at low input levels giving steady readings and making high-resolution period measurements possible.
Frequency output can be directly plotted using FFT software such as Spectrum Lab or Argo and the frequency is easily sent wirelessly.
Dirt cheap!
Linearity adjustment can remove some non-linearity from the source as well as the reset non-linearity. V/Fs are naturally monotonic and the non-linearity is gently spread over the full range.
Not shown is that a transistor may be added to pull pin 2 down for external sync. greatly reducing the tendency for the last digit to jump around in simple digital counter applications. The gate signal simply turns on the 2N4403 until the counter is ready to count again making the circuit start at the same point for each count period. (Not needed when using FFT analysis.)
This open-loop design relies on key components' stability for precision but the lack of feedback gives it remarkably low jitter especially at low input levels. The input signal is compared to a divided-down version of the power supply so the frequency output is proportional to the ratio of the input voltage to the power supply voltage. This ratiometric response gives added stability when measuring voltage dividers or bridges even after amplification.
Since there is no feedback it would be expected that the finite width of the reset pulse would cause the frequency to read low as the input voltage increases. That little error can be corrected by making the reference voltage track the input voltage slightly. Mathematically the correction is perfect and the linearity can be tweaked to better than 0.01% of span for a full-scale frequency of around 10 kHz.
The 1000 pF capacitor is critical and should be an COG (NPO) or similarly stable capacitor for best results. Film types are fine for lower frequency work in a lab environment but a more stable capacitor is best for higher frequency operation especially in a variable temperature environment. A proper choice of components will give excellent temperature stability. The MPSA18 connected to pin 1 is also critical and only very high gain types will work well. Precision metal film resistors are recommended for best stability but carbon film types are fine for the experimenter's lab.
It's hard to adjust the gain and linearity without a precision voltage switchbox, perhaps with 1 volt steps from 0 to 5 VDC. The voltages can (probably should) be simply divided down from the power supply thanks to the ratiometric response but use high-precision or matched resistors for maximum accuracy. Just a string of matched resistors across the power supply connected to the input with a clip lead will suffice. It's practical to get four digits of accuracy with a good setup and care.
The output of several V/Fs could be combined through fairly large resistors of different values to plot several variables on one chart. The different value resistors will present different amplitudes to Spectrum Lab so each trace can be made a different color. (Try a rainbow color scheme like "Too Many Colors.")
Here's briefly how it works: The first op-amp and MPSA18 sink current in proportion to the input voltage. The capacitor voltage ramps down at a rate determined by the input voltage. When the capacitor voltage drops below the reference voltage on pin 9 the comparators change state and the PNP discharges the capacitor very rapidly. The discharge is so fast that it is completed before the comparators have time to reset. The 2N4403 has a very low saturation temperature coefficient when biased as shown so it makes a stable reset switch, albeit with a little offset voltage which is calibrated out during initial adjustments. This little marvel has a saturation voltage temp-co that crosses through zero as a function of bias current. The reset pulse is quite short so the last comparator is added to generate a square wave output but the short pulse is fine for driving a frequency counter.
OBSOLETE after this point! I can't bring myself to delete them.
Serial Port A/D - 12 bits, no power, cheap!
Here's a cute but obsolete way to use an old serial port's handshake lines to get data into a Windows 98 and earlier computer. The circuit toggles a 12 bit counter driving a 12 bit D/A and uses a comparator to detect when the D/A output passes the input voltage. It works really well but good luck getting Qbasic to run!
24 Line Parallel Interface for the PC (or just the schematic)
This is a really old parallel port for the PC, back when Windows 3.11 was all the rage.