
The SID Seizer is a VLF/LF receiver project for monitoring Sudden Ionospheric Disturbances, typically caused by solar flares. This article assume the reader has basic knowledge of the effects of solar flares on the ionosphere. (A web search will yield a wealth of information on SID reception, including other simple designs, typically employing loop antennas.)Breaking with tradition, the SID Seizer uses a vertical whip antenna with a tuned amplifier, instead of a tuned loop.
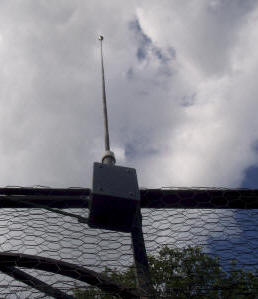
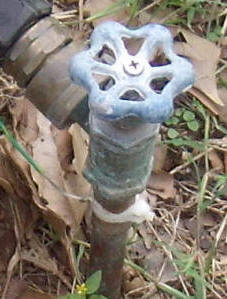
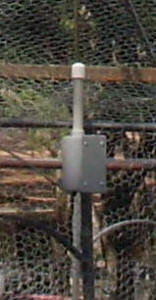
Since monitoring SIDs tends to take a lot of time, it's desirable to have dedicated equipment, including the antenna. For this experiment, a dedicated active antenna is mounted above a garden fence, held on by two screws on the right and a cable tie on the left. A ground wire runs down to the garden's water pipe. That cable tie around the water pipe should be replace by a proper clamp at some point. The electronics is housed in an ordinary PVC electrical junction box with the antenna sticking out a hole in the top of a length of conduit with a cap. I drilled the hole in the cap such that the antenna rod was a snug fit, then I filled the tube with caulking foam from the inside to keep water out.
The antenna preamplifier consists of two units, an antenna unit and an indoor unit, and they are connected by a length of ordinary telephone wire. It probably doesn't matter, but to reduce the capacitance a bit, I used both blue wires for ground and both orange wires for the signal. I lose a bit of shielding that way, but it works well.
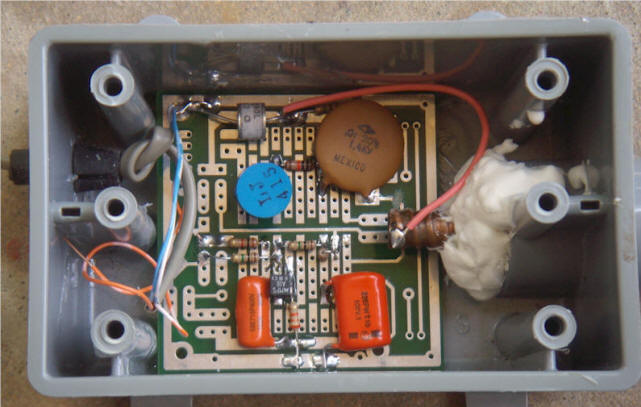
A surge suppressor, bleed resistor and single transistor stage are located in the antenna box. The antenna is connected to a Littlefuse surge arrestor but any similar device should be fine, perhaps just a neon bulb. The 1 megohm resistor slowly discharges the antenna. The antenna is coupled to the transistor amplifier with a high-voltage disk capacitor. (All those efforts are attempts to protect the transistor from nearby lightning strikes and static build-up on the antenna.)
A 220 mH works against the transistor's miller capacitance to give a nice roll-off above about 100 kHz. The 100k resistor kills the Q of this resonance to give a reasonably flat response, and the resistor limits impulse current in the transistor to a couple of mA, in the event the surge suppressor fires. The 220 mH choke is not critical; higher values will begin the roll-off earlier and lower values might let in AM radio stations that might cause problems in simple receivers. If the MPSA18 isn't available, try to find a high gain NPN type as a replacement. An ordinary 2N4401 will work, in a pinch. The second stage is indoors, with a six cell battery pack (9 volts). The battery is intentional overkill; both stages draw less than 200 uA, so a pack of C-cells should last for several years of continuous duty. Using batteries for the preamplifier eliminates the pesky ground-loop problem that lets line-related noise into the system. A telecom transformer is used to completely isolate the antenna ground from the following circuitry and computer. This particular transformer has a winding inductance of 2.4 mH, so a .003 uF capacitor was added in parallel to resonate at 60 kHz. That capacitor would be increased to around .018 uF for receiving 24 kHz. ("Your transformer may vary.") An ordinary untuned audio transformer would probably work fine; those common telephone isolation transformers would be worth a try.
Plot of mast unit's response:
The simulated mast unit's response is shown above. Note: this is a simulation of only the mast unit and not the tuned second stage. The indoor unit has a tuned transformer that adds selectivity at the particular frequency of interest. Tuning the indoor unit in this fashion reduces the battery current requirement for a given gain. The indoor unit is in a large case, mainly for the batteries, but feel free to package it any way you desire. Batteries are a good idea for isolation, but I've had good luck with ordinary molded power supplies, too. However, don't just connect the antenna ground to your computer's ground or the AC ground, or you will be inundated with noise from the computer and power line.
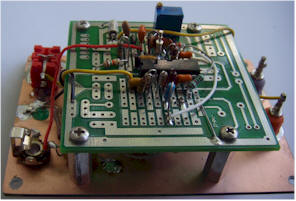
The PNP transistor amplifier and output transformer are mounted on a piece of perfboard near the input connector and the resonating capacitor for the transformer is located near the output connector. A screw terminal block allows for easy changing of the resonating capacitor. You might want to make the capacitor a front panel plug-in or switch selectable value. I've come to the conclusion that I'll leave the thing on one frequency for months at a time.
No power switch is included, but the battery does have a fuse in series, in case something gets shorted. The power consumption is low enough to ignore, but the current can be completely shut off by unplugging the input. Different experiments will plug into this antenna unit and the gain will be lowered to the desired value simply by adding a shunt resistor across the input connector of the particular experiment. For example, the 24 kHz SID receiver below had far too much gain, so a 470 ohms was connected across the 24 kHz receiver's input connector. A gain resistor or potentiometer (5 or 10k) could be connected in parallel with the resonating capacitor in the indoor unit. Perhaps the gain resistor should be soldered to the resonating capacitor since that cap is selected for the particular signal of interest.
Note: don't try to place both transistors in the antenna unit. The two stages are non-inverting and have lots of gain, so stability problems will probably result. Yes, I did. And it oscillated, hopelessly. You could lower the gain of the second stage, but having a large signal lets one "get away with murder" at the receiver. For example, my somewhat odd 60 kHz receiver below mixes the RF with a 60 kHz local oscillator in the same plastic box; a trick that requires a lot of signal to have a prayer of working.
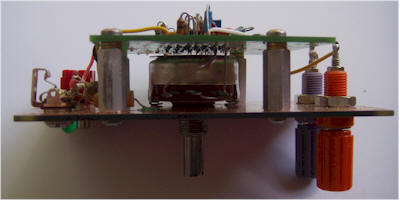
Indoor unit:
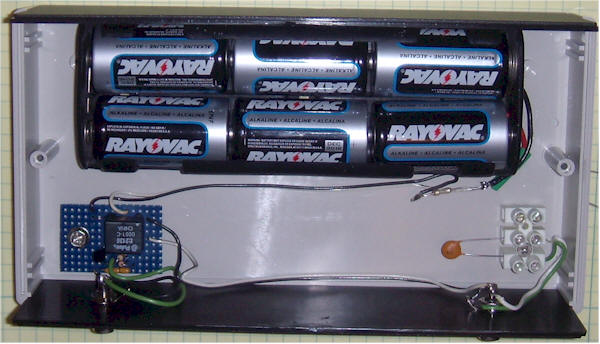
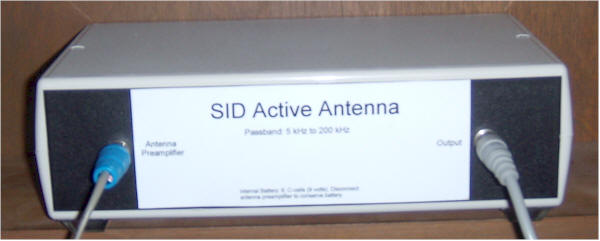
Note the "upside-down" case with the screws in the top. That makes it easy to take the lid off without turning it over. There is so much room, I should probably add a panel switch with caps for several frequencies.
This antenna and preamplifier will provide a good signal for a variety of receivers, including:
24 kHz SID Receiver (receives the traditional submarine communication signals using unorthodox circuitry)
Oddball SID Receiver Experiment (receives a very weak 60 kHz WWVB signal to produce wonderful SID plots)
Note: If you wish to monitor more than one transmitter at a time, you can modify the indoor unit to provide a flat response from about 10 kHz to over 60 kHz by replacing the Pulse B2136 with an audio telecom transformer. Here's the new circuit and simulated response of the whole circuit:
The two pieces are together in this schematic, but I highly recommend separating them into an "antenna unit" and an "indoor unit" as before for stability. This much gain right near the antenna will probably lead to oscillation.
My particular transformer has a primary inductance of 3.4 Hy and a turns ratio of 1.4: 1. The 3.3k resistor and .0033uF capacitor help shape the response. If you have a similar 600 ohm "phone" transformer, start with these values and adjust them to get a good response over the band. Yours will probably be 1:1 or 2:1.
Caution: the 24 kHz receiver below uses a shunt resistor to set the gain and that should be changed to a 10k potentiometer if another receiver is to use the same antenna signal. The pot goes between the signal and ground and the wiper goes to the 0.1 uF capacitor. You should be able to hook a few high input impedance receivers to the output of this unit without additional buffering.
This first experimental SID receiver works with the above antenna preamplifier with a .018 uF tuning capacitor in place of the indicated .003 uF capacitor, or use the broadband version directly above. The receiver is made from a single CD4069UB hex inverter, a certified nutty idea, but it works well. It can be fun to get these old workhorses to do new tricks.
Note: the gain select resistor works by loading the antenna amplifier which may be undesirable if you wish to run another receiver from the same active antenna. Use a 10k potentiometer to ground across the input with the wiper going to the 0.1 uF capacitor in that case. The remote antenna unit has a lot of gain so if you don't have as much antenna signal in your setup, the gain of this circuit may be greatly increased by lowering the value of the 100k between pin 1 and the input. Although I didn't test it thoroughly, I've gone as low as zero ohms without obvious problems.
The first inverter (pins 1 and 2) forms a low gain amplifier that buffers the filter section from the input. The 33 pF capacitor stabilizes the inverter, a necessity when they're used at low gain and power supply voltages much above 5 volts. This is different from the typical higher gain configuration you often see.
The next stage is used as a summing amplifier, summing the input signal and a feedback signal. (Think of each inverter as a low gain op-amp with its positive input connected to Vcc/2. So these amplifiers are simply traditional inverting op-amp stages. The two following integrators are right out of an op-amp handbook, with an input resistor and a feedback capacitor.)
The next two stages are integrators with two, 1000 pF integrating capacitors and two, 10k input potentiometers. The capacitors are critical! Not just any type will work. Choose NPO (COG), mica, Teflon, glass, or polystyrene. Other types are probably not good enough. It makes a big difference.
The two integrator pots may be ganged for easier adjustment. Even if you don't want to waste a nice dual-gang pot on a project that will end up sitting on one frequency, it is nice to do the initial adjustments with a dual type. The problem is that, as the two values diverge, the Q changes significantly. The Q set resistor is also quite sensitive, so a potentiometer is recommended there, too. Once the filter is tweaked up perfectly, changing only one of the 10k pots can tune the frequency a few kHz without terrible Q shifts. The tune-up procedure is described after the rest of the circuit description.
The output of the filter at pin 8 feeds two more amplifiers made from the last two gates. There's plenty of gain for most situations, but the gain may be adjusted up or down by varying the input resistors to the amps. Eventually, you will want the rectified output voltage to be about 1 volt maximum at nighttime when the signal peaks. The output of the last stage (pin 12) drives a simple diode detector and low-pass filter. The output has a 1 megohm resistor in series, so it's only good for driving a DMM or other high impedance load. The monitor output was added as an afterthought to allow for listening to the signal with a crystal earphone and for observing the amplified audio output on an oscilloscope. It's nice to be able to see and hear the actual signal when preparing a receiver.
The power supply should be well regulated for this circuit. The frequency and Q are somewhat sensitive to power supply variations.
Alignment can prove tricky. The filter is regenerative and can break into oscillation during alignment, typically when the Q set resistor is too low. The first step is to set the Q set resistor and two gain resistors near 5k . If the output is oscillating, increase the Q set resistor until it just stops. (Make sure it will oscillate when the Q set resistor is lower, just to verify that everything is OK.) Connect a signal generator to the input set to just a few millivolts output near 24 kHz. Tune the signal generator around to find a peak, anywhere from 10 kHz to 40 kHz. If it doesn't seem to peak very much, lower the Q set resistor. Adjust the two 10k integrator pots until the peak is at 24 kHz. Keep in mind that the Q set resistor also changes the frequency. Check the bandwidth by adjusting the signal generator amplitude until the output at the monitor connector peaks at 600 mV, p-p, then finding the two frequencies on either side of that peak reading where the amplitude drops to 400 mV, p-p. It doesn't matter if it is exactly centered on 24 kHz just yet. You will want a total bandwidth between 200 Hz and perhaps 400 Hz. Now, fiddle with those two adjustments until you are exactly peaked at 24 kHz with the desired bandwidth, say 300 Hz. That can take some patience, by the way, and the patience of Jobe if you are doing it without the benefit of a ganged pot. I did it with a single 2.5k pot in series with a 9k resistor and practically went bald! (Doing it "the hard way" involves lots of soldering in trial resistors. My 2.5k pot doesn't have much range and I wanted the pot to be nearly centered when finished.)
Once you have the values dead on, remove one of the 10k integrator pots and measure it with an ohmmeter. Make sure to keep your fingers off the electrodes so that you get an accurate reading. Now, find a combination of fixed resistors that give you the same resistance. It is preferable to use stable metal film resistors, but carbon film types will suffice. Install that fixed resistor in place of the pot, and use a lower value potentiometer in series with a fixed resistor for the other integrator (I used a 2.5k pot and about 9k of fixed resistance, since I needed almost exactly 10 k). That single pot will allow you to tweak the frequency over a few kHz range. Verify that the frequency can be centered at 24 kHz with the pot near center position, then replace the Q setting pot with a fixed value, too. That's about all there is to it, but it can be harder than it reads. Remember to keep the amplitude low when making these adjustments, well below 1 volt p-p at the output. I used 600 mV p-p, because a drop to about 400 mV represents a 3 dB decrease and that's easy to see on a scope. Also, use a frequency counter if the signal generator doesn't have an accurate frequency readout. You will notice that the bandwidth gets a little lower at the higher frequencies and vice-versa. If you use too large of a potentiometer for the tuning (like the original 10k) you might get an oscillation above 26 kHz or so. Breaking into oscillation won't hurt anything but it can be annoying.
When you connect the antenna and tune the receiver to a signal, a DC voltage will appear at the output, if all is well. The signal will get stronger at night so it might take a few nights to find the best gain select resistor to keep the output below 1 or 2 volts. (The Keyboard Wedgie data recorder is limited to 1 volt.) I found it convenient to shorten the antenna to drop a little gain, too. My antenna is in two foot sections and I ended up using only 8 feet and a fairly low gain set resistor of 470 ohms. There's a pretty strong signal here in Austin.
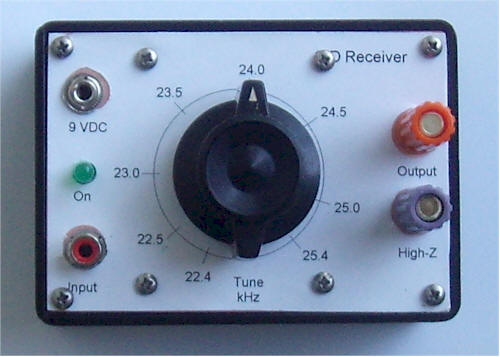
I used a cad program to make the label but I started with a dial with lots of lines, pasted on a temporary label, and marked the exact position of the dial for the different frequencies. I then used those marks to locate the lines for the final label.
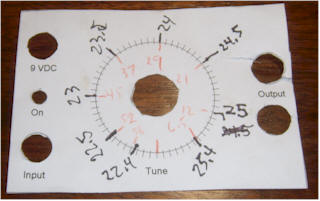
I didn't to the world's greatest job cutting out the holes for some of the components and I managed to land "SID" right under a screw. Ah, good enough!
Any prototyping method is fine, it's just audio. This circuit worked very well on a white proto board with long clip leads going every which way. This particular prototyping board is a bit of an oddball I found on eBay, so don't read anything into the special-looking traces. That blue potentiometer was a gain pot (the 47k at pin 13), but the gain turned out to be so high, I left it set at maximum (50k). The gain for my receiver is reduced by a resistor that is across the red input connector. A 1k resistor and LED were added across the 9 volts to indicate the presence of power.
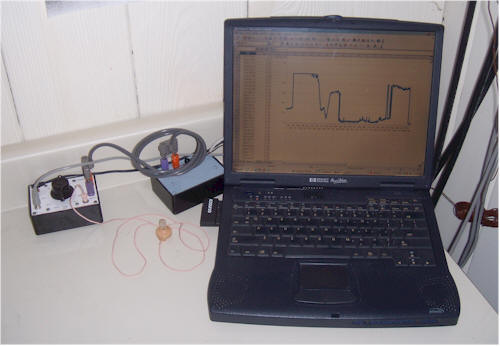
The setup above doesn't show the antenna or the indoor unit with the big batteries which is sitting across the room. Note the added earphone "monitor" jack. The audio from the antenna comes into the receiver via the RCA connector on the left, and the output of the receiver goes to the Keyboard Wedgie via the banana cable. Any A/D input device is fine, of course. I like the Keyboard Wedgie because it requires no special software on the computer (unless you use the scroll lock LED flasher as a trigger). You can use it to enter the binary data into any program, including WordPad.
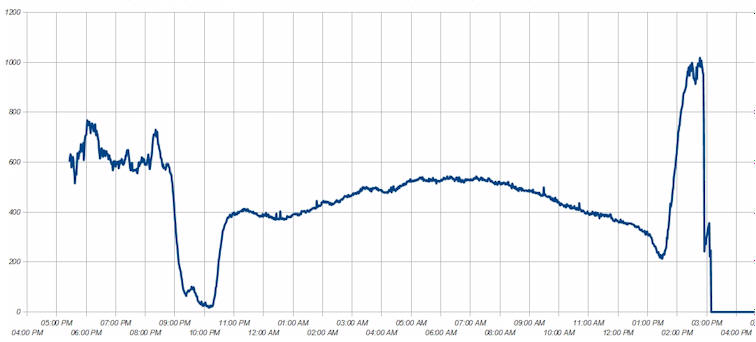
The computer shows the very first day-long run, and the data agrees well with other monitor stations. Below is another plot made the next night:
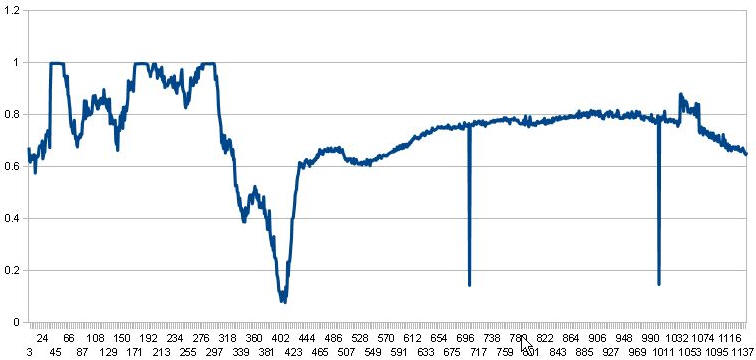
About 10:30 PM (6/14/2010) to 5:30 PM (6/15/2010). The graph clips at 1 volt, the full-scale input of the data taker.
This plot shows the signal just clipping at night, a dip at sunrise, a "rolling hill" that is typical of signal strength during the day, and a little burst of something near the end of the day. Not bad for a first try. It turns out that this very old laptop is not quite up to the job. It gets "busy" now and then for no apparent reason and misses entries. Those two drop-outs are actually the computer ignoring some of the bits of a couple of measurements.
Ah-ha, I saw the culprit in action! Openoffice.org has a default timed backup that takes just long enough to mess up the occasional data point. If your old computer is slow like mine, look under Tools/Options/Load/Save/General, and deselect Save "Autorecovery Information". Now, where did I put that old laptop...
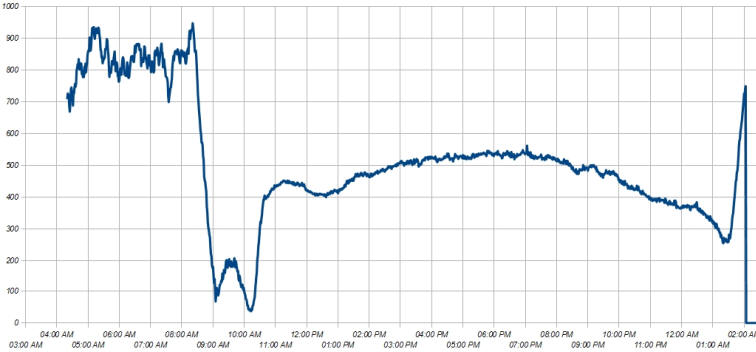
Here's a bare-bones spreadsheet for use with the Keyboard Wedgie and 1 minute samples. The spreadsheet is written for Openoffice.org. Unlike the above plot, it has a time scale.
The above plot was made with the spreadsheet and a faster computer that doesn't bog down with housekeeping tasks. This is a pretty typical-looking plot showing a large signal before dawn, followed by a deep dip at sunrise. Then a gentle hill is seen during the daylight hours. That hill is where the SIDs would be seen. At sunset, the signal dips then rises sharply. The drop at the very end is due to the transmitter beginning an on/off routine that lowers the detected reading. The plotter was stopped just after 3:00 AM, GMT. (AM and PM are switched on the plot.)
Here's the next day. Note the similarities, even before dawn.
See an improved receiver at wenzeltech.com
The live plot at the top of this page is being made by the following receiver. The antenna/preamplifier at the top of this page is tuned to 60 kHz with a .03 uF capacitor for driving this experimental WWVB receiver and the broadband version should also work well.
During the summer months WWVB (60 kHz) nearly disappears at my home during the day (Austin, Texas). Just enough remains to see a slight "mound" rising out of the noise. That's a perfect situation for SID detection and I like the idea of using WWVB, because the signal is predictable and rarely "tampered with."
It's a challenge just to see the tiny daytime signal. This receiver manages to pull the signal out of the noise by using extremely low bandwidth, achieved in an unorthodox manner. Here's the inside of the receiver:
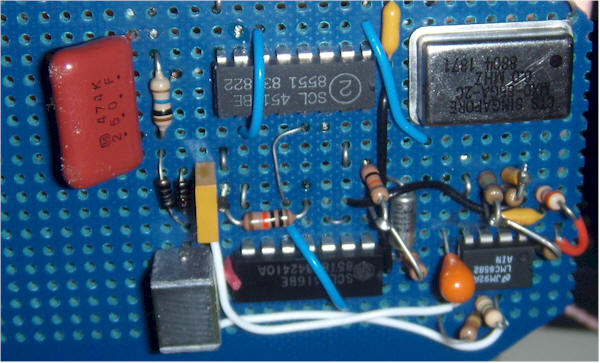
The 6 MHz oscillator is intentionally chosen to be a little off frequency, about 100 to 200 Hz. It is divided down to 60 kHz (off about 1 to 2 Hz) and used to chop the received 60 kHz with an analog switch. Since the oscillator is slightly off frequency, the converted 60 kHz signal comes out at about 1 or 2 Hz. This low frequency signal passes through a 3 Hz low-pass filter and is rectified. The effective bandwidth is quite low and the signal just peaks up above the noise. The receiver is fed by the antenna and amplifier at the top of this page.
I don't recommend this circuit as a project for a beginner, but supply it as a curiosity. If you're experienced, give it a try; it's pretty interesting to use. I'll just snap a photo from my notebook:
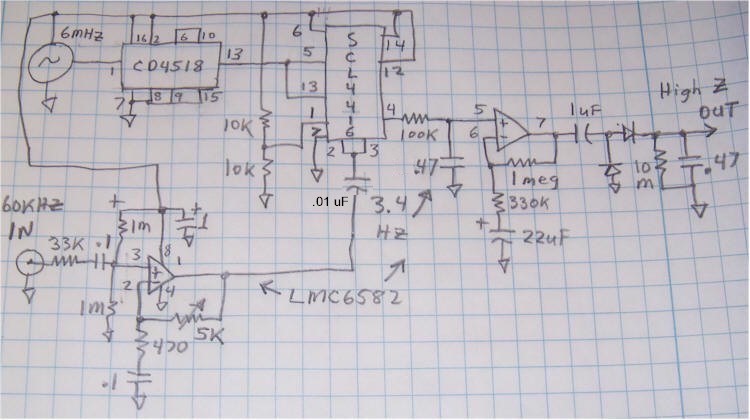
This receiver needs the antenna and two-transistor preamplifier at the top of the page.
Pin 14 of the SCL4416 and pin 8 of the op-amp go to 5 VDC (trace at top of schematic), supplied by the Keyboard Wedgie.
The output is a very high impedance and directly drives the Keyboard Wedgie, which has an extremely high input impedance. You may wish to add another op-amp voltage follower at the output if the load will be a lower impedance. I also added an external 3.9 uF capacitor across the output for additional filtering (not shown).
Note: Right now, I'm using a Dataq DI0148U and an Excel Spreadsheet, instead of the Keyboard Wedgie. Both work great, but the spreadsheet is a little more hands-off for 24/7 plotting. See Data Loggers. I use the Meter/Data Acquisition Amplifier to buffer and amplify the signal.
Adjust the gain such that the plot "drags bottom" during the day, to maximize the headroom for large flares. Adjust the RF gain pot and the feedback resistor between pins 6 and 7, if necessary, to get a small DC voltage during the day. You can also adjust the length of your antenna to tweak the gain.
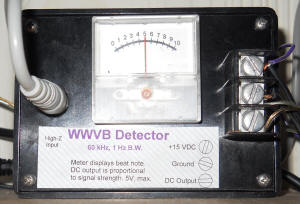
The white connector in the picture is connected to pin 1 of the op-amp through a 1k resistor and .1 uF capacitor and is for monitoring the audio with a crystal earphone or amplifier (not shown on the schematic). You can't hear 60 kHz, but there's enough gain at audio frequency to hear lightning and other potentially interfering broadband signals like an arcing line transformer.
You can connect an analog voltmeter to pin 7 of the output op-amp to watch the beat note. I recommend a sensitive analog meter with the negative input connected to pin 1 of the analog switch or to another pair of resistors to get V/2. The needle will "look confused" as it constantly changes direction due to the new phase modulation on the signal.
I've recently built another version for monitoring the magnetic field component. I'm not showing a big loopstick inductor, resonating capacitor, and 60 dB amplifier since that magnetic antenna uses special parts others aren't likely to have. But the receiver circuit works the same way as the electric field one above and this new circuit will work just fine with a whip antenna and preamplifier. It uses more readily acquired components:
Only 2 of the 8 outputs of the CD4051 are used. Similarly, a CD4052 or CD4053 may be used with appropriate modifications to the circuit. The 74HC390 is connected to generate a 50/50 duty-cycle square wave at 60 kHz. This unit has modest gain as it is driven by a 60 dB amplifier/loopstick antenna (not shown).
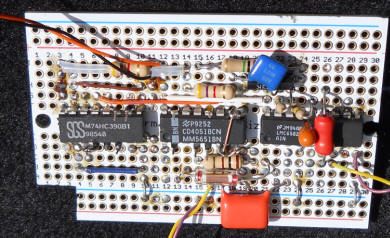
It's amazing how much circuitry one can get on an Adafruit prototyping board if one is willing to put parts everywhere! Note the oscillator was graded to be 1.4 Hz high at 60 kHz; a little frequency error is necessary.
The clock oscillator is chosen to be off frequency by about 100 Hz, say between 50 Hz and 200 Hz, either high or low, so that there is about a 1 Hz "beat note" between the divided-down 60 kHz clock and WWVB.
The diodes are schottky small-signal types like the 1N5711.
If you add a larger capacitor across the output for more filtering, use a low leakage type. Make it a tantalum, if it's an electrolytic. For the newer version directly above, simply increase the 4 uF - don't add capacitance across the output.
The op-amps aren't critical; looking at the schematic, I don't see why an LM358 wouldn't work, but I might lower the bottom 10k resistor on pin 2 of the '4416 (pin 11 of the '4051)to about 6.8k, so that the op-amp's output is at about 2 volts with no input signal. The LM358 can swing near ground but only up to about 3.5 volts. Lowering the bias point will allow for a larger AC signal to the diodes. Or, just choose a "rail-to-rail" type op-amp like the one shown. The newer circuit could use all the same type; I just hate to "waste" one in a dual type!
The SCL4416 may prove hard to find, but I have a tube of them, so send me an email. The same applies to the other parts; I tend to use parts I have in quantity, when possible. Or just switch to the second circuit using the more common 74HC390 and CD4051,2 or 3.
The following is an early plot I made with an ancient computer and the first Keyboard Wedgie.
Here's an M 3.0 flare captured on 10/16/2010:

It's flat on top because the level exceeded the PIC's input range. The gain was a little high when this plot was made.
I wrote an Autohotkey script that waits until 5 AM, local time, then starts flashing the ScrollLock LED every minute until 9 PM. You can use the .exe as-is, to start at 5 and stop at 9. Both the .exe and the .ahk text file are in the zipped download. If you want to be cautious, load the .ahk into Autohotkey to make your own .exe. You can look at and edit the .ahk script with Notepad, it's simple text, but you need AutoHotkey to run or compile it. AutoHotkey is a handy tool!
With Autohotkey, you can open the .ahk file and modify the times to your preference. All you really need to change is the "5" and "21," if you don't want to start at 5 AM and stop at 9 PM, local time. But, you may want to change the name of the line "waituntil10" in two places, to reflect the true UTC time. That change does nothing and would simply be for clarity in the future, it's just a line name. Or just rename the line in the two places to something more generic like "waithere."
The beauty of a script that starts and stops is that you can run the program at any time, say after dinner, and it will patiently wait until dawn to start taking data. (The nighttime signal is less interesting for SID monitoring.) The plot will stop after sunset and the script will close, preventing run-on spreadsheet data.
A "Keyboard Wedgie" programmed to ignore every other scroll flash saves data every 2 minutes, to keep the size of the spreadsheet down. You can stick with 1 minute readings, without much trouble; my old, old laptop barely keeps up at 2 minutes. Send me an email, if you would like a copy of the 2 minute Wedgie program for the PicAXE.
Also see dataloggers for other inexpensive computer interface suggestions; currently this receiver is driving a Dataq device and Excel to make the live plot at the top of this page.